So let's get started, for this project we need the following things.
 |
| Temperature and ADC Counts Visualization using Python |
 |
| Temperature and ADC Counts Visualization Using LabVIEW |
- Arduino Board
- SD Card Shield
- DS1307 Shield
- LM35 Temperature Sensor
The simulation diagram is as follow:
As can be seen in above figure that, SD card is connected to SPI pins of Arduino and DS1307 is connected to I2C pins of Arduino.
 |
| Simulation Diagram |
Arduino Part
In this project, DS1307 is used to provide time and date to Arduino and based on this information, Arduino will create a file in SD Card with name as date and starts logging the temperature values measured using LM35 sensor along with time.
In this project, DS1307 is used to provide time and date to Arduino and based on this information, Arduino will create a file in SD Card with name as date and starts logging the temperature values measured using LM35 sensor along with time.
First coming to the SD Card part, before creating file and starts writing to it, we need to initialize the SD card, and Arduino has inbuilt library for this named "SD Library". Click here to read the documentation.
I will use this library and the following lines are used to initialize the SD card.
I will use this library and the following lines are used to initialize the SD card.
  if (!SD.begin(chipSelect))
  {
    Serial.println("Card failed, or not present");
    /*Exit Program*/
    return;
  }
  Serial.println("Card Initialized.");
The next important thing is RTC (DS1307), Arduino IDE doesn't have any in-built library for this, so you have to download the RTCLib from this link.
After installing this library, you can use this library to initialize and get timing information from DS1307 RTC. The following lines, will declare the DS1307 object in code and check if it is present on I2C bus or not.
The code given above is for the initialization part, now coming to the working part. As a first step, I will read time and date information from this Real-Time-Clock and store them in variables, and this will be done by using the following lines.
After installing this library, you can use this library to initialize and get timing information from DS1307 RTC. The following lines, will declare the DS1307 object in code and check if it is present on I2C bus or not.
/*DS1307 Object*/
RTC_DS1307 rtc;
.
.
.
/*Check for RTC*/
if ( !rtc.begin() )
{
  Serial.println("Couldn't find the RTC");
  return;
}
Serial.println("RTC DS1307 Initialized");
The code given above is for the initialization part, now coming to the working part. As a first step, I will read time and date information from this Real-Time-Clock and store them in variables, and this will be done by using the following lines.
now = rtc.now();
day = now.day();
month = now.month();
year = now.year();
year = year-2000u;
hour = now.hour();
minute = now.minute();
second = now.second();
Now we have date and time information in the variables. As a next step, I will generate the filename, based on the date information.
Note:
SD Library used here, only support filename length of '8.3', which means that the filename of maximum 8 characters and file type of maximum 3 characters with a '.' in between. This is reason year is subtracted by 2000, so that we can get the year value in 2 digits.
The character array with filename can be generated using the following line.
Now we have filename and time with us, we need our temperature data, which can be read from the analog channel pin 'A0' of the Arduino.
LM35 temperature sensor output's 10mV signal per degree Celsius rise in temperature.
So if we have voltage, we can use the following formula to get the temperature.
The above piece of code, converts the adc counts in temperature plus it also store the fractional part. Then this complete data is updated in character array buffer. Now the only thing left is to write this data into SD card, which will be done by the following lines of code.
Open the file with name date, in write mode and then write the buffer data into it and then close the file.
The complete code will generate the logs in the memory card with name 'date.txt', for example '01-20-18.txt' and the content of that file will be as follow:
Python Part
Now coming to the Python part, with Python we are going to visualize the temperature and adc data along with time on x-axis.
This task is basically divided into two main parts, the first one is reading the file content and the another is visualizing the data.
For reading file, I am going to use Pandas module, and for plotting graph I will use Matplotlib module.
The following commands can be used to installed these two modules from the windows command prompt.
For Python 2.x.x
Note:
SD Library used here, only support filename length of '8.3', which means that the filename of maximum 8 characters and file type of maximum 3 characters with a '.' in between. This is reason year is subtracted by 2000, so that we can get the year value in 2 digits.
The character array with filename can be generated using the following line.
snprintf( filename, FILE_NAME_LEN,"%.2d-%.2d-%d.txt", month, day, year);
Now we have filename and time with us, we need our temperature data, which can be read from the analog channel pin 'A0' of the Arduino.
LM35 temperature sensor output's 10mV signal per degree Celsius rise in temperature.
So if we have voltage, we can use the following formula to get the temperature.
Temperature = Voltage(mV)/10;
Now next question is how to convert the adc counts into Voltage, so the formula is as below.
Voltage (mV) = ADC Counts * 5000mV/1023
Complete formula to get Temperature using ADC Counts can be obtained from above two formulas and is given below.
Temperature (degree Celsius) = (ADC Counts * 5000mV/1023)/10
I will use the above equation in my Arduino sketch to get the temperature value, the following piece of code is doing the same thing.uint32_t temp; uint8_t fract; // Fractional Part temp = (uint32_t)adc_count * (uint32_t)5000u; temp = temp / 1023u; fract = temp % 10u; temp = temp/10u; int n = snprintf(buffer, BUFFER_SIZE, "%.2d:%.2d:%.2d,%d,%lu.%u", hour, minute, second, adc_count, temp, fract);
The above piece of code, converts the adc counts in temperature plus it also store the fractional part. Then this complete data is updated in character array buffer. Now the only thing left is to write this data into SD card, which will be done by the following lines of code.
myFile = SD.open(filename, FILE_WRITE);
myFile.println(buffer);
myFile.close();
Open the file with name date, in write mode and then write the buffer data into it and then close the file.
The complete code will generate the logs in the memory card with name 'date.txt', for example '01-20-18.txt' and the content of that file will be as follow:
16:08:45,64,31.2
16:08:46,60,29.3
16:08:47,60,29.3
16:08:48,60,29.3
16:08:49,60,29.3
16:08:50,60,29.3
16:08:51,60,29.3
16:08:52,60,29.3
16:08:53,60,29.3
16:08:54,60,29.3
16:08:55,63,30.8
16:08:56,63,30.8
16:08:57,63,30.8
16:08:58,62,30.3
16:08:59,62,30.3
16:09:00,63,30.8
16:09:01,63,30.8
16:09:02,60,29.3
16:09:03,62,30.3
Python Part
Now coming to the Python part, with Python we are going to visualize the temperature and adc data along with time on x-axis.
This task is basically divided into two main parts, the first one is reading the file content and the another is visualizing the data.
For reading file, I am going to use Pandas module, and for plotting graph I will use Matplotlib module.
The following commands can be used to installed these two modules from the windows command prompt.
For Python 2.x.x
pip2 install matplotlib
pip2 install pandas
For Python 3.x.x
pip3 install matplotlib
pip3 install pandas
The first step is to open the file, and for that the following command is used.
df = pd.read_table( filename, ',', names=headers, engine='python', header=None)
df is data-frame which will contain the data read from the file.
filename is the name of the file which needs to be opened.
',' is the delimiter, as in our Arduino program we are using comma as delimiter, so this needs to be specified here also.
names=headers will categories the data frame, the value of headers in our case is given below.
headers = ['Time', 'ADC', 'Temperature']
Now we have our data read from the file, but there is a little problem with the time, as we have only read time and there is no date information, so what Pandas will do, it will automatically add 1900 as year and 1 as month and 1 as day.
That's why we will add current date, month and year, to our time, although it is not required in our case, but it's still good to add this, and this can be done by using the following lines.
FMT = '%H:%M:%S'
df['Time'] = df['Time'].map(lambda x: datetime.strptime(str(x), FMT))
df['Time'] = df['Time'].map(lambda x: x.replace(day=date, month=month, year=year))
Now, everything is fine, we can proceed with the plotting part, which can be done by the following commands.
plt.plot( df['Time'], df['Temperature'])
plt.show()
That's all, so by this you can visualize your temperature data.
This complete project is available on GitHub, please click here to download the complete Arduino and Python code.
Watch Video on YouTube.
LabVIEW Part
Now coming to the LabVIEW part, with LabVIEW we are going to visualize the temperature and adc counts along with time on x-axis.
You have already seen the output on XY graph in LabVIEW on the top of this post and the following figure is of block diagram.
 |
| LabVIEW Block Diagram |
The component required are as follow:
- File Path: This is used to get the file-path along with the file name.
 |
| File Path |
- Read From Text File: This is used to read the content of the file in the form of string.
 |
| Read From Text File |
- Scan From String: This is used to format the string and separate the time, adc count and temperature values.
 |
| Scan From String |
- For Loop: This is used to scan complete content of the file.
 |
| For Loop |
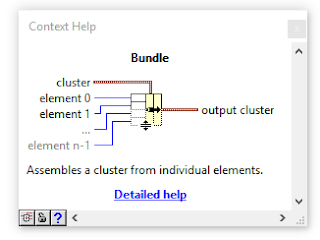
- Bundle: It is used to form cluster from the data, to make it suitable for plotting graphs.
 |
| Bundle |
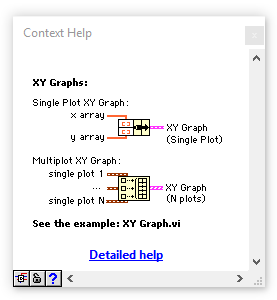
- XY Graph
 |
| XY Graph |


No comments:
Post a Comment