Hello Everyone, in this post I would like to share a problem that I am getting when I am trying to debug my STM32 micro-controller-based project in "Labcenter Electronics Proteus".
The Proteus Design Suite is a proprietary software tool used primarily for electronic design automation. The software is used mainly by electronic design engineers and technicians to create schematics and electronic prints for manufacturing printed circuit boards.So, I am using the Proteus to simulate a simple project based on an STM32F4 microcontroller, and when running the simulation it was working fine also, but when I tried to debug this project with Proteus, I get a "Fatal Simulation" Error message.
Here by debugging I mean to say that I wanted to put breakpoints inside the code and do single-step debugging but it failed with the "Fatal Simulation" Error message, which is also shown in the image below.
 |
| Fatal Simulation Error in Proteus |
 |
| Fatal Simulation Error in Proteus |
The normal *.hex file was working fine, but when I wanted to do debugging using the debug files, such as the *.elf file or *.out file, it fails with the above message.
The development environment which I am using is IAR Embedded Workbench (IAR Compiler), and I also tested with STM32CubeIDE (GNU Compiler), so the debug files generated by both of these compilers failed to run on the Proteus.
I investigated and found the root cause of the problem that why this is not working and how to fix this problem.
Root Cause of the Problem
The default debug output files generated by the IAR Compiler and GNU GCC Compiler is in dwarf4 format, while the Proteus can handle or work with dwarf2 format only as of now, so due to this reason whenever I tried to debug the program with these files, I get "Fatal Simulation" error as for Proteus the file format is not acceptable.
Solution to the Problem
The solution to the problem is simple, we just need to change the format of the debug file generated by these compilers from dwarf4 to dwarf2. I will show you this can be done in STM32CubeIDE and also in IAR Embedded Workbench project settings.
First, let's start with STM32CubeIDE, here we have to open the "Project Properties" and then go to "C/C++ Build" and then go to "MCU GCC Compiler" and then Select "Miscellaneous".
 |
| Adding Compiler Flag Setting |
And then click on the "+" button to add a compiler flag "-gdwarf-2" and by doing so the output file generated will be in dwarf2 format.
 |
| Updating Compiler Flag to generate dwarf2 format in STM32CubeIDE |
 |
| Updating Compiler Flag to generate dwarf2 format in IAR |
Apart from this in IAR, we have to do one additional change, and this is changing the debug output file name from *.out to *.elf as shown below. This can be done by going into the "Linker" setting and then selecting "Output", also make sure the checkbox "Include debug information in output" is checked.
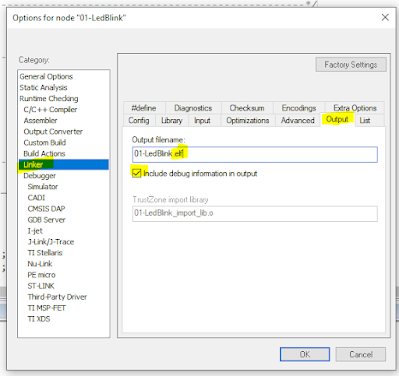 |
| Generating *.elf file in IAR |
 |
| Debugging in Proteus |
If you like this post also check my YouTube channel for more such interesting topics.


No comments:
Post a Comment